 What is PCE?
Introduction: US PCE Indicators – The Fed’s Preferred Inflation Gauge for Retail Investors
In today’s dynamic market, a deep understanding of economic indicators is essential for informed decision-making. US Personal Consumption Expenditure (PCE) indicators, the Fed’s preferred measure of inflation, provide a comprehensive view of consumer spending trends and overall economic activity.
These indicators offer critical insights into shifts in consumer behavior and serve as an early warning system for inflationary pressures, enabling both traders and retail investors to adjust their portfolios in anticipation of market changes.
This guide is structured to provide you with a professional and detailed overview of:
- PCE Makeup: A breakdown of the six key metrics that constitute the PCE.
- Historical Performance: An analysis of historical trends through detailed charts.
- Impact on Asset Classes: Insights into the effects on equities, bonds, FX, and crypto.
- Conclusion & Actionable Insights: Practical steps based on the latest information.
Whether you are an experienced trader or a retail investor, this article is designed to equip you with the professional insights needed to make sound investment decisions.
Discover how US PCE indicators reveal key inflation trends and influence the performance of various asset classes.
PCE Makeup: Key Metrics Explained
The US PCE report is typically released at the end of each month and reflects data for the preceding month. It provides six key metrics that offer a comprehensive view of consumer spending and inflation trends. The metrics below are listed in order of criticality.
▇▇ Core PCE Price Index YoY
Widely regarded as the most critical indicator, this metric excludes food and energy to provide a stable view of underlying inflation. For example, if the index rises from 98 to 100 over a year, it signals a 2% increase. This change is a key factor in decisions regarding interest rate adjustments.
▇▇ PCE Price Index YoY
This measure compares the overall PCE (including food and energy) with the same period last year. An increase from 100 to 104, for example, indicates a 4% rise in consumer prices, offering broader context for inflation trends that may affect monetary policy.
▇▇ Core PCE Price Index MoM
This metric tracks the month-over-month change in the core PCE, excluding food and energy. For instance, an increase from 110.0 to 110.2 represents approximately a 0.18% rise, which helps monitor short-term inflation trends that could prompt adjustments in interest rate expectations.
▇▇ PCE Price Index MoM
Capturing the overall monthly change in consumer prices—including food and energy—this metric can be more volatile. For example, a rise from 112.0 to 112.5 reflects roughly a 0.45% increase, influencing short-term market sentiment and future rate moves.
▇▇ Personal Spending MoM
This indicator measures the month-over-month change in consumer spending. A 0.4% increase, for example, suggests heightened consumer confidence that may drive demand and exert upward pressure on prices—a factor considered when setting interest rates.
▇▇ Personal Income MoM
Tracking the monthly change in personal income, this metric offers insight into consumers' purchasing power. For instance, a 0.3% rise in income indicates increased earnings that can boost spending and contribute to inflationary pressures, potentially influencing monetary policy.
Understanding these metrics is essential for assessing current inflation levels and anticipating potential interest rate changes. Next, we will examine the historical performance of these indicators to better understand long-term trends and their implications for the market.
Historical Performance of PCE Indicators
The chart below presents the year-over-year changes in the PCE Price Index from 2015 through 2024. In the years leading up to the COVID-19 pandemic, inflation remained relatively modest, with the PCE YoY figures gradually rising from 1.0% in 2015 to around 1.6% in 2019. However, the onset of the pandemic in 2020 dramatically disrupted economic activity, resulting in an unprecedented drop to just 0.3% as consumer spending contracted sharply.
As the economy began to recover in 2021, we witnessed a rapid rebound in inflation, with the PCE YoY climbing to 3.9% and ending 2022 at 6.6%. This surge was driven by a combination of pent-up demand, supply chain disruptions, and expansive fiscal and monetary policies implemented to support the recovery. Although inflation moderated somewhat to 2.5% in both 2023 and 2024, these figures underscore the lasting impact of COVID-19 on inflationary pressures.
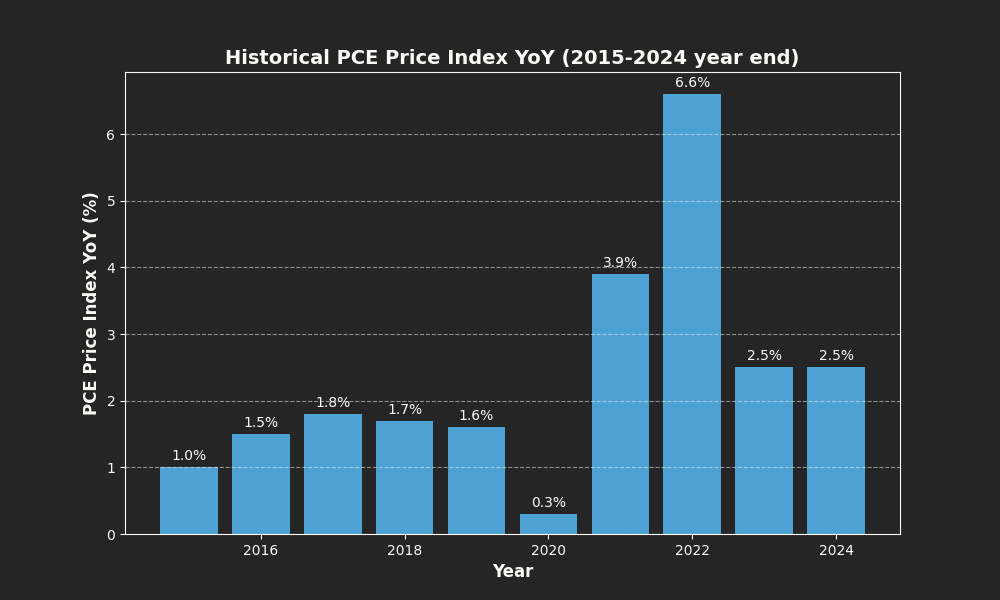
This detailed historical perspective illustrates how a major external shock like COVID-19 can lead to significant deviations from long-term trends, influencing both inflation expectations and monetary policy decisions. Such shifts ultimately have profound implications for asset prices and investment strategies.
In the next section, we will examine how these inflationary trends, as captured by the PCE indicators, impact various asset classes such as equities, bonds, foreign exchange, and cryptocurrencies, providing actionable insights for retail investors and traders.
Impact on Asset Classes
Inflation trends driven by US PCE indicators have significant implications for various asset classes. Shifts in US PCE data affect market sentiment, pricing, and risk across equities, bonds, foreign exchange, and cryptocurrencies. Below, we explore how each asset class is impacted, along with practical examples.
Equities
US PCE trends help us understand how much consumers are spending and how fast prices are rising. These trends have a direct impact on corporate performance. When the PCE report shows rapidly increasing prices, it generally indicates rising inflation. Companies may then face higher costs for raw materials, labor, and other inputs, which can squeeze profit margins and reduce overall earnings.
Example:
Imagine a manufacturing company that suddenly faces a sharp rise in production costs because the prices of raw materials, energy, and labor have all increased due to inflationary pressures. As these input costs escalate, the company’s profit margins shrink since it becomes more expensive to produce each unit of output. This erosion in profitability makes the company's stock less attractive to investors, who may start to favor investments with more stable earnings. In contrast, companies in defensive sectors such as consumer staples or utilities tend to perform more consistently during inflationary periods. Their products and services, like everyday food items or essential energy supplies, remain in steady demand regardless of rising prices, which helps maintain their profit margins and keeps their stocks relatively attractive even when inflation is high.
Bonds
Bonds are very sensitive to changes in inflation expectations, as reflected in the US PCE data. When the report shows rising inflation, investors often anticipate that inflation will continue to increase, leading them to demand higher yields. As yields rise, the market value of existing bonds falls because their fixed interest payments become less attractive.
Example:
Suppose current bond yields are around 2%. If rising PCE figures prompt investors to expect higher inflation, they may demand higher returns on new bond issues to compensate for the expected loss of purchasing power. As a result, yields could increase to 3% or more. This increase in yields means that bonds already issued at the lower yield of 2% become less attractive, since new bonds would offer better returns. Consequently, the market value of the older bonds drops, as investors are not willing to pay as much for a bond yielding only 2% when they can obtain a bond yielding 3% or higher. This dynamic demonstrates how rising inflation expectations can directly affect bond prices and overall portfolio performance. For more details on how inflation impacts bonds, please refer to our MoneyIQ Bonds Guide.
Foreign Exchange (FX)
FX markets are significantly influenced by inflation expectations, often derived from US PCE data. When the report indicates rising inflation, it suggests that US consumer prices are increasing faster than expected. This may lead investors to anticipate a weakening of the US dollar compared to currencies from countries with more stable inflation.
Example:
Consider a scenario where US PCE data indicates a sharp rise in inflation while European inflation remains relatively steady. In this situation, investors may begin to expect that the US dollar will weaken compared to the euro. This expectation arises because higher inflation in the US can erode the purchasing power of the dollar, making it less attractive to hold. At the same time, if European inflation remains low, the euro may maintain its value or even strengthen in relative terms. Such a shift in currency strength can have several broader economic effects: it may alter trade balances by making US exports cheaper and imports more expensive, and it can influence international capital flows as investors seek assets in more stable currency environments.
Cryptocurrencies
Cryptocurrencies have emerged as an alternative asset class that some investors consider a hedge against inflation. When US PCE data signals rapid price increases, investors may look to digital assets like Bitcoin as a store of value.
Example:
During periods when traditional inflation measures surge—such as in the post-COVID recovery—investors may reconsider the composition of their portfolios and shift a portion of their assets into cryptocurrencies. This move is often driven by the perception that digital assets, like Bitcoin, can serve as a hedge against inflation by preserving value when fiat currencies lose purchasing power. However, while cryptocurrencies have the potential to provide high returns and act as a store of value, they are also subject to extreme price fluctuations. This inherent volatility means that although there is the possibility of significant gains, investors also face substantial risk. As a result, those considering cryptocurrencies must balance the allure of high returns with the risk of rapid price swings and market uncertainty.
Understanding these asset class dynamics in the context of US PCE inflation trends is crucial for retail investors and traders. By incorporating these insights into your investment strategy, you can better navigate market volatility and adjust your portfolio as inflation expectations evolve. Next, we will explore the tools and resources available to help you monitor these trends and make informed investment decisions.
Conclusion & Actionable Insights
US PCE indicators offer a powerful window into inflation trends and consumer spending patterns, serving as a critical tool for forecasting market shifts. By understanding the makeup of PCE, examining its historical performance, and evaluating its impact on different asset classes, you can make more informed decisions in an ever-changing economic landscape.
Based on our analysis, consider the following actionable insights:
- Regularly monitor US PCE reports and related economic data to stay ahead of market trends.
- Reassess your investment portfolio periodically, adjusting your exposure to equities, bonds, FX, and cryptocurrencies in response to changing inflation expectations. For a balanced approach, refer to our Balanced Investment Portfolio Insights.
- Stay informed with expert insights and guides and tailor your strategy to your risk tolerance and financial goals.
By integrating these insights and strategies into your investment approach, you can better navigate market volatility and position yourself to capitalize on emerging opportunities. Thank you for reading, and we hope these insights empower you to make well-informed, confident decisions in your financial journey.
Disclaimer
This article is for informational purposes only and should not be considered financial advice. Always conduct your own research and consult with a qualified financial advisor before making any investment decisions.
MoneyIQ Team